We just wrapped up the 2026 TTRA Marketing Outlook Forum here in Charlotte, and one thing became crystal clear: Destination Marketing Organizations are craving more than raw campaign numbers. No more spreadsheets full of CTRs and clicks. Instead? A campaign narrative; storytelling that explains what’s happening, why it’s happening, and what it means for their destination’s growth.
Metrics matter, but the magic happens when you turn them into a clear picture that all stakeholders can understand. When your reporting shows how visitors interact with your destination, why campaigns succeed or stumble, and the impact is makes on ROI, that’s when metrics really drive decisions.
Metrics That Tell a Story
Numbers are useful, but context is everything. As a DMO, your team needs reporting that goes beyond raw data:
- Visitor demographics alone aren’t enough. Explain what their behavior means for marketing, events, and experience development.
- Economic impact isn’t just a total spend. Show how it supports local businesses, community development, and destination funding.
- Digital engagement isn’t just clicks. Illustrate how online activity drives actual visits, bookings, or inquiries.
Think of metrics as plot points in your DMO’s story. Each number should answer: What’s happening? Why is it happening? What do we do next? That’s the kind of insight DMOs actually want.
KPIs With a Narrative
Traditional KPIs are still important (they’re your raw ingredients), but DMOs care about the recipe. Here’s how to make your KPIs tell a story:
Visitor Numbers and Demographics
Knowing who visits is the first step, but telling the story behind the numbers is what makes reporting valuable.
- Total visitors per season
- Age and gender distribution
- Geographic origin of visitors
For example, your DMO might see that family visits spike in the Fall, particularly from nearby states. Instead of just noting “5,000 visitors from neighboring states,” the story can become something like: Fall visits are dominated by families from the Tri-State area, drawn by seasonal festivals. Marketing campaigns that highlight family-friendly events are driving this increase. Focusing on local influencer partnerships and targeted social ads during late summer could further boost visitation.
This transforms raw data into actionable insight, showing what’s happening, why, and what to do next.
Economic Impact and Visitor Spending
Tourism isn’t just fun, it’s part of a destination’s economic engine. Reporting should illustrate how dollars translate into community growth, and how fluctuations can impact it in either direction.
Metrics to track include:
- Total visitor spending
- Average spend per visitor
- Direct and indirect economic impact
Imagine your data shows an uptick in spending at boutique hotels and local dining during a specific festival. Instead of just reporting the numbers, you should tell a story and give the full picture (i.e., promoting the festival to the right visitor persona next year should create the same result). This links marketing efforts to real-world outcomes, allowing your DMO to more accurately forecast economic impact based on marketing performance.
Digital Engagement: Website, Social, and Email Metrics
Digital channels are often the first impression visitors have of a destination. Reporting should show how online engagement drives offline action.
Metrics to follow:
- Website visitor count and conversion rates
- Social media engagement (likes, shares, comments)
- Email open and click-through rates
Instead of reporting “10,000 website visits and 500 clicks,” turn it into a narrative. This shows why people care about your destination’s content and what action to take next.
Event and Campaign Performance
Events are investments in your destination’s visibility, and campaigns are investments in storytelling. Metrics alone won’t tell the whole story.
Metrics to track:
- Total attendance
- Attendee satisfaction ratings
- Social media reach during campaigns
Storytelling adds context to the numbers and shows the direct impact of your campaigns.
Accommodation and Occupancy Rates
Accommodation metrics reveal seasonal trends and demand insights, but they’re more than just numbers.
Metrics to track:
- Average room occupancy rates
- Seasonal demand fluctuations
- Average daily rate (ADR)
Turning these raw numbers into tactical recommendations helps guide marketing and operational decisions.
Advanced Reporting: Context, Comparison, and Forecasting
Storytelling gets richer when you layer in advanced metrics analysis:
- Benchmarking: Compare your destination against competitors to see strengths and weaknesses.
- Predictive insights: Forecast trends to anticipate visitor demand and revenue opportunities.
- Real-time data: React quickly to spikes in bookings, social engagement, or visitor interest.
These tools let your reporting show trends, impacts, and future opportunities, not just historical performance.
Best Practices for Story-Driven DMO Reporting
- Prioritize outcomes, not outputs: Show impact, not just activity.
- Use visuals to tell the story: Charts, graphs, and heatmaps make insights more digestible.
- Connect metrics to action: Every insight should guide strategy or decision-making.
- Highlight community impact: DMOs thrive on demonstrating value to partners, local businesses, and stakeholders.
Story-driven reporting is memorable and persuasive. It shows ROI, guides decisions, and communicates value to anyone from city councils to tourism boards.
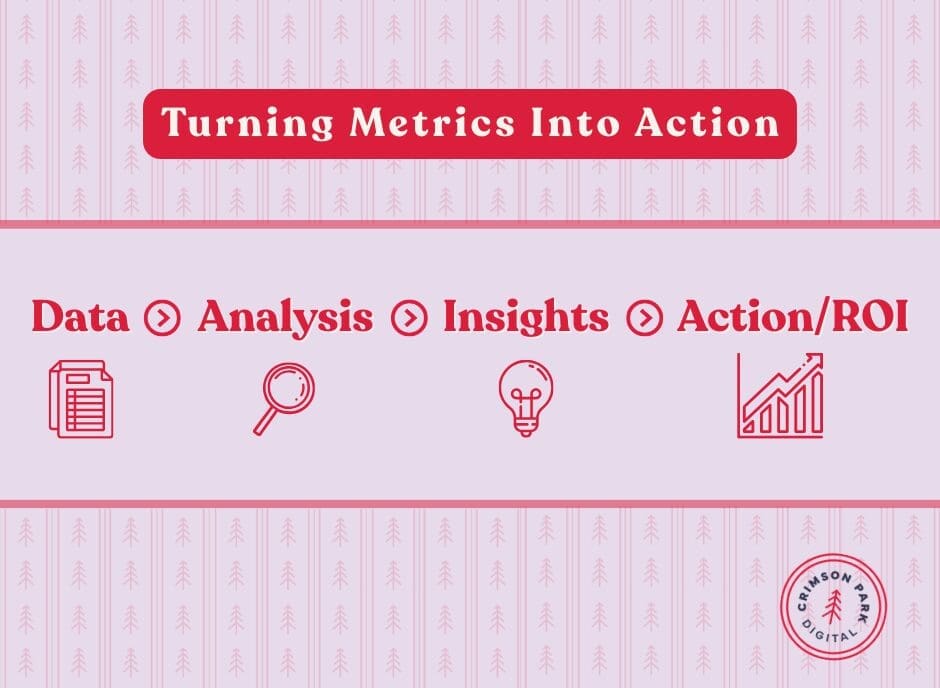
Turning Metrics Into Action
Data isn’t enough on its own. Insights must inspire decisions. Look for trends that indicate opportunities or challenges, then outline clear action steps.
Feedback loops are essential. Monitor results, adjust strategies, and iterate. This ensures your DMO stays proactive rather than reactive.
Uncover DMO Metrics With Meaning
As a DMO, you want stories that explain what happened, why it happened, and what to do next. Metrics become powerful when they are contextual, actionable, and aligned with strategic goals.
Partnering with a digital marketing agency (hello!) can help your DMO turn data into stories that drive strategy, maximize ROI, and grow destinations smarter.

Ready to transform your DMO reporting into insights that actually guide decisions? Let’s chat!